
Unfortunately, “pollinator declines” are part of our vernacular nowadays. You’ve probably heard of the rusty patched bumble bee, Bombus affinis — the Midwestern bee on the Federal Endangered Species List. You may have heard about Franklin’s bumble bee, Bombus franklini, which hasn’t been seen since 2006. Maybe you’ve heard about the recent studies showing widespread pollinator range contractions or population declines in Europe, North America, or elsewhere.
In my home state of New York, our Natural Heritage Foundation just released the results of its 3-year Empire State Native Pollinator Survey, finding that 38% of native pollinators in the state are at risk of extirpation (https://www.nynhp.org/projects/pollinators/). That’s over a third of our native pollinators that are at risk of being lost from the state!
Pollinator declines can seem like a hopeless issue. The problem is just too big, too diffuse, or is occurring over too long of a timescale for any of us to truly comprehend or do anything tangible about it.
But what if we look at pollinator populations on a scale that’s familiar to most of us — a handful of properties within a short drive — and we monitor the bees for a familiar period of time — the equivalent of time between starting junior high school and graduating as a high school senior? Is it possible to see pollinator population changes in only six years? This is the topic for the fifty-eighth Notes from the Lab, where I summarize “Six years of wild bee monitoring shows changes in biodiversity within and across years and declines in abundance,” written by Nash Turley and colleagues and published in Ecology & Evolution [2022].
For their study, Turley and colleagues collected bees in and around four Southern Pennsylvania apple orchards every week from April to October for six years (2014-2019). Very impressive! The orchards were all within a few miles of each other in a mixed agricultural/natural landscape near the town of Biglerville (see Figure 1). On the one hand, this means it’s impossible to know if the patterns observed in this study are representative of what’s happening over a broader geographic area. On the other hand, it also means it’s an excellent snapshot of the world that most of us experience in our day-to-day lives (i.e., a few miles around our homes). For me, this makes the data feel real. In other words, it feels like what I’d see in my neighborhood if I was diligent enough to observe and identify every bee.
At each site, bees were caught with Blue Vane Traps (see Photo 1), a type of trap that attracts and captures a wide variety of bees. In previous work, the authors found that nearly all bee species were more likely to be captured in Blue Vane traps over more standard “bee bowls,” except for some mining bees (Andrena) and small sweat bees (Lasioglossum).
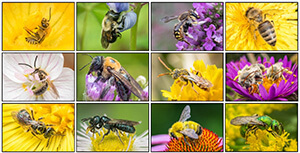
Once collected, all bee specimens were stored in alcohol until they were washed, pinned, and labeled. All bees were identified to species using published dichotomous keys and the expertise of bee taxonomists. In total, 26,716 individual bees representing 5 bee families, 30 genera, and 144 species were collected over the course of the six-year study (see Photo 2). A very impressive dataset.
So, what did they find? Were there enough bees for the authors to investigate population and community trends over time? Yes. Turley and colleagues collected 144 bee species, which represents 33% of the species known to exist in the state of Pennsylvania. In other words, they sampled a species-rich bee community. Most species were rare; for half of the species, 5 or fewer individuals were collected. This is typical when species-rich communities are surveyed. However, 40 of the bee species had enough observations to look at population trends over time.
What were the population trends? Was there evidence for declines? Yes. As seen in Figure 2, out of the 40 most abundant species, 26 were stable over time and had no detectable change in abundance between 2014-2019. However, 13 species (i.e., 33% of the species) declined in abundance over time. Many of the declining species were bumble bees and sweat bees, but declines were widespread across 7 bee genera (Bombus, Ceratina, Melissodes, Melitoma, Lasioglossum, Halictus, and Agapostemon; see black points in Figure 3). By contrast, only one species increased in abundance over time — the two-spotted longhorn bee, Mellisodes bimaculatus.
In addition to changes in abundance, the authors also observed declines in the number of bee species. An average of 40-46 bee species per site were observed in the first years of the study, which dropped to an average of 30 species at the end of our study.
Were there seasonal changes in bee communities throughout the year? Yes, a lot! As seen in Figure 3, the bee community experienced pronounced seasonal turnover as different bee species became more or less abundant. For example, some bee species were abundant early in the season (e.g., Andrena, Osmia), some were abundant later in the season (e.g., Melissodes), and others were present throughout the season (e.g., Apis).
Well this is all a bit troubling. Does this mean pollinator declines occurred during the authors’ six-year study? That’s the million-dollar question. Some researchers have suggested at least 10 years of data are needed to detect long-term patterns in insect populations. If that’s true, this study would need to carry on for four more years before evidence of declines would be deemed conclusive. In addition, it’s possible the lethal Blue Vane trapping actually negatively impacted the bee populations. Whether that’s true or not is impossible to know, but a quick calculation shows about 1,100 bees were collected at each site each year. That’s surely a small proportion of the total bees present at each site each year and probably unlikely to negatively impact the populations of 13 species. But perhaps it’s a big enough dent to make an impact over six years. Clearly it would be convenient to have non-lethal ways of conducting rigorous bee surveys.
The authors are continuing their bee collections with the hope they can provide concrete evidence of population trends ….