Honey bee management instructs beekeepers to leave the hive undisturbed after installing a new queen in a standard three-hole Benton shipping queen cage, provided with the familiar candy-release mechanism. The beekeepers usually wait for three days, maybe four. During that time, the hive becomes a black box, holding its secrets about how the colony typically transitions from queen rejection to collectively “deciding” on her fate –– to accept her as their mother queen or kill her as a foreign intruder.
The beekeeper knows only the final result, learned by inspecting the brood combs. The welcomed sight is queen-laid eggs, placed one per cell, typically in patches, indicating queen acceptance. The more distressing situation is when the queen introduction fails. The beekeeper finds no eggs. The queen cage is completely empty, licked clean to bare wood and wire. The colony is becoming weaker by the day. Our universal question is: What happened? What happened to my expensive new queen?
From the experiments described in the previous article, the time until the number of bees balling the queen cage went to zero was the main focus, because that was our indication of queen acceptance. We learned that during marginal nectar flow conditions, colonies took longer to accept queens when attendant bees were present.
Now instead of determining the time until balling stopped, for this article we follow the number of ballers during those times, glimpsing into that forbidden black-box transitional time leading to the queen’s acceptance or her death. That is precisely when beekeepers have been told for decades not to open the hive during this delicate transitional period of the introduction process. So to be clear, the carefully-designed experiments reported here were for scientific research only. Absolutely do not open your hive too soon and risk the expensive loss of your new queen bee.
The graphs in this article tell the responses of colonies to their new queens. Think of the graphs as concise ways to tell the queen introduction story of the colony. Figure 1 shows the typical setup for Experiment 1 (from the previous article), beginning without attendant bees. Time (in hours) is plotted on the horizontal x-axis. The maximum duration of the experiment is at the far right. The number of bees balling the two-screen compartments of a standard 3-hole Benton queen cage is plotted on the vertical axis, its maximum being 40. Forty is about the maximum number of aggressive ballers that can occasionally pack themselves over the screen compartments with bees.
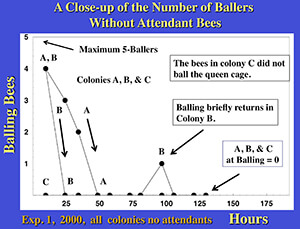
Without attendant bees, Figure 1 shows the number of ballers was small as suggested by all the white space in the graph. I kept the vertical scale up to 40 in Figure 1 for comparing this graph to others with attendant bees, which required that same vertical scale (because those colonies showed more aggression toward their queens). Before conducting those comparisons, let’s zoom in on Figure 1 to enlarge its details when attendant bees were not present (see Figure 2).
For ease of explanation in Figure 2, I renamed the three colonies A, B, and C. On the first count, Colonies A and B both started out with four bees balling their queen cages. (By chance the counts happened to be the same.) Four ballers were quite a low number, given that the number can vary up to 40. Nevertheless, four ballers do not indicate queen acceptance.
Following the time series of Colony A, its ballers decreased to three and then to two on the subsequent counts. By 48 hrs (near 50 hrs on the x-axis), Colony A had stopped balling the queen cage. Moreover, the bees of Colony A never resumed balling the queen cage, an effect that will gain importance in upcoming examples. Essentially then, Colony A had accepted its queen in two days.
Colony B had a slightly different transition to queen acceptance. The bees stopped balling the queen cage in 24 hrs (near 25 hrs on the graph). Complicating matters, however, on day four (96 hrs, near 100 hrs on the x-axis), one bee balled the queen cage, making the graph jump up one unit. That one bee balling the cage did not precede additional long-lasting balling, because the next count was back at zero, where the counts remained. That minor balling (one bee) seemed to be isolated, transient in nature.
When Colony B accepted its queen is a bit murkier because of the transient balling. The decision becomes a judgment call. I would say acceptance occurred early on, from day one or two because the transient balling was never part of any additional sustained balling, suggesting some low level of aggression toward the new queen.
Colonies A and B displayed behavior that I had observed in other hives, mostly my top-bar observation hives in the bee house, when introducing queens without attendants. Usually the balling began at low numbers, and then the counts decreased quickly to zero. After seeing a brief run of zero counts, if I observe one or even a few ballers on the cage again, that balling is transient. It vanishes, leaving the only bees on the cage displaying accepting behavior.
Colony C was the intriguing case. I had seen its time series in my bee house with the observation hives –– and always without attendant bees. Remarkably, Colony C did not ball its queen cage. Look on the x-axis, over in the left corner at the first count. C begins at zero. All the way over to the last count, the Cs are zero. No aggression. So are the bees in Colony C some exotically rare creatures? I do not think so. If you have 10 hives of (genetically diverse) bees, one, maybe two of those hives would be like Colony C. Keep reading to find out how I knew that. I really need a special research project just for bees like Colony C.
Next we move on to the situation when attendant bees remained in the queen cages. The short-term unpredictable fluctuations in the number of ballers over time (time series) became more pronounced. Furthermore, the long-term trends in the time series became more complicated (compared to when attendant bees were absent).
Generically, I call these trends aggression patterns. I broadly classified them based on whether or not the balling stopped, and, if it stopped, whether or not the balling resumed substantially (see below). I present these aggression patterns, roughly in order of their “strangeness.” Although from studying the details of numerous queen introductions, these aggression patterns have become familiar occurrences.
A reasonable concern is that frequently opening the hives to count the ballers could generate and maintain the observed aggression patterns (an experimental artifact). I designed the inspection procedure to greatly minimize or eliminate that possibility. Moreover, the aggression patterns observed in the apiaries from the large top-bar hives had all been seen routinely in the smaller top-bar observation hives in the bee house. There in the glass hives, the ballers can be counted quickly and efficiently without opening the hives. And if needed, I can watch my observation hives in the bee house all night long. (I am working on a method to do that in my top-bar apiaries.)
We begin with Figure 3, showing the first aggression pattern called a decay. In a queenless colony, a decay is defined as –– the number of ballers decreasing toward zero in an exponential-like fashion. (A smooth curve fitting the data would begin at some initial number of ballers corresponding to when the queen introduction began. The number of ballers would decrease in a curve over time, concaved-up, coming close enough to zero (ballers < 1) to declare queen acceptance. Overall, that curve resembles the well-known exponential decay from classical atomic physics where an unstable isotope like radioactive uranium decays exponentially into other products. Other mathematical models decrease with upward concavity, but they lack the familiarity of exponential models. (Also without attendant bees, Colony A in Figure 2 suggests other time series graphs can be concave downward and decrease differently than exponential.)
Notice in Figure 3, the initial number of bees balling the queen cage was quite large, 23, a little more than half the maximum numbers of ballers (40). As expected, the number of ballers decreases, forming one colony’s particular response. Perhaps we can use Figure 3 as a beginning to understand the aggression toward a new queen upon her release.
If so, this colony had 14 bees still balling the queen cage 24 hours later. I do not know how much 14 ballers would convert to direct aggression displayed toward the new queen. Nevertheless, I would expect a dangerous level of hostility. If the bees released the queen in 48 hrs, a more ….