Increasing use of land for crops in the United States negatively impacts wildlife while producing marginal benefits for farmers
In any competition, there are winners and losers. This is abundantly clear in sports, of course, when one team wins the championship and the other loses. But it’s also true in normal life. For example, when natural habitat that supports wildlife is converted to cropland, wildlife loses that habitat while humans gain more land to produce food.
So, how is this scenario playing out in the United States? Are we losing habitat for wildlife as our desire to produce more food increases? If so, how extensive are the losses, and how does this impact wildlife such as pollinators? Conversely, how extensive are the gains in terms of agricultural production? In other words, are humans winning big and producing a lot more food while minimally impacting wildlife, or is the opposite true? These are the topics for our thirty-fifth Notes from the Lab, where we summarize “Cropland expansion in the United States produces marginal yields at high costs to wildlife,” written by Tyler Lark and colleagues and published in Nature Communications [11:4295].
For their study, Lark and colleagues first tracked changes in cropland throughout the United States during an eight-year period (2008-2016). Specifically, the authors used nationwide cropland maps from the USDA Cropland Data Layer (CDL) and National Land Cover Dataset (NLCD) to determine when non-cropland became cropland, and vice versa. Cropland was broadly defined as any area planted to cultivated row, closely grown, or horticultural crops, and included cultivated fallow and alfalfa. Their methods for determining shifts in land use improved upon previous work by identifying year-to-year changes at very high resolution (30 m spatial scale) while also keeping track of crop-specific changes.
Next, to evaluate productivity of new cropland compared to pre-existing cropland, the authors paired their change in land use results described above with crop-specific yield data for corn, soybean, and wheat fields. Yield data were obtained from 10 years (2008-17) of county-level crop yield averages from the USDA’s Agricultural Resource Management Surveys. Estimates of yield from new croplands were compared to pre-existing cropland yields in two ways: first, by comparing to the national average of pre-existing cropland yield for each crop, and second, by comparing to the local average in pre-existing cropland yield for each crop (within a 10 km x 10 km radius of the new field).
Finally, Lark and colleagues assessed the impacts of land use change on habitat suitable for the Monarch butterfly (Danaus plexippus), migratory game species (nesting waterfowl), and native plant communities (long-term grasslands). These taxa were selected for their familiarity to the public, representation of a broad range of wildlife types, and recognition as indicator species. To assess impacts on Monarch butterflies, the authors estimated loss of milkweed stem numbers while considering areas that were previously enrolled in the Conservation Reserve Program (CRP). To estimate impacts on duck breeding pair nesting accessibility, U.S. Fish and Wildlife Service habitat maps were used that account for spatial variation in habitat quality across multiple years and environmental conditions. To estimate impacts on long-term grasslands, locations which had never been classified as cropland or pasture/hay in any year of the NLCD were considered to be long-term and thus approximated native prairie.
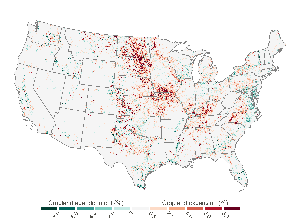
So, what did they find? Is cropland in the U.S. expanding? Yes. Overall, cropland in the U.S. expanded at a rate of over one million acres per year, for a total of 10 million acres added between 2008 and 2016. During the same period, only 3.5 million acres of cropland were abandoned or converted to non-agricultural use. In other words, the net increase in U.S. cropland was 6.5 million acres between 2008-2016, as shown in Figure 1.
(Editor’s note: For context, USDA numbers show comparable cropland acreage to be stable overall for the 43 years prior to the study, while shifting between geographic regions: “… between 1964 and 2007, cropland used for crops … increased by 11 million acres in the Corn Belt and decreased by a net 11 million acres in the remaining regions.” Crop yields continue to rise due to advances in technology, but export markets and federal farm policy often affect crop production more than the need to feed Americans.)
Expansion of land used for farming occurred at the highest rates in Midwestern states such as Missouri, Iowa, Kansas, Nebraska, and North and South Dakota (red shading in Figure 1). However, cropland expansion occurred throughout the country, with major increases also observed in Kentucky, Tennessee, and North Carolina.
Grasslands, including those used for pasture and hay, constituted 88% of land converted to crop production across the U.S. Other major land cover types that were converted included shrublands in the West, wetlands in the northern Plains, and forests in the Southeast.
What about productivity of the new cropland? Are we producing food at high rates on the new land? Unfortunately, no. And this is important. Overall, compared to pre-existing cropland, 69.5% of new cropland areas produced yields below the national average, with a mean yield deficit of 6.5% (Figure 2 panels a, b, and c). Yield deficits were less pronounced when new cropland was compared to pre-existing cropland at the local scale, but still negative (Figure 2 panels d, e, and f). These results indicate land that is suboptimal for growing crops in the U.S. is starting to be used for exactly that purpose. Yield deficits were most pronounced for land converted to corn and soybean production, which together with wheat, represented 78% of the new land converted to ….